
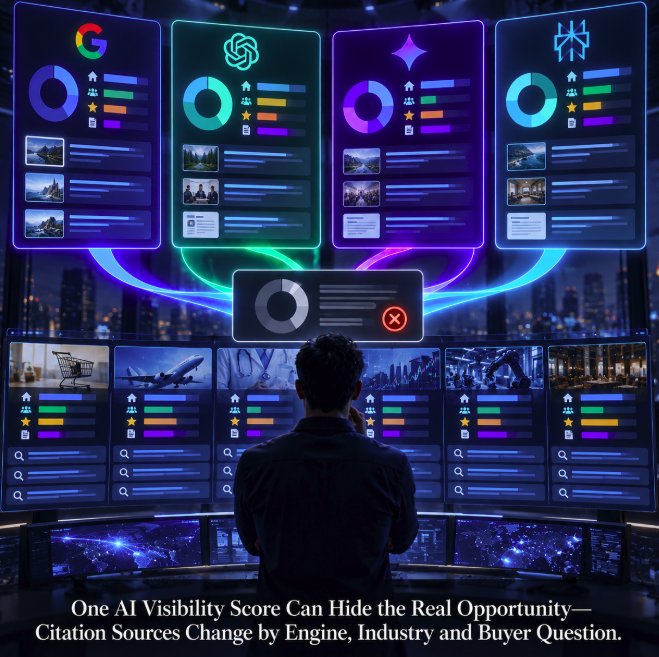
AI visibility dashboards naturally invite aggregation. One score is easy to report, easy to compare with competitors and easy to place in an executive slide. But a methodology presented by Trendos argues that this convenience can hide the information marketers actually need: the sources shaping AI answers can change materially depending on the engine, the industry and the exact question a buyer asks.
In a September webinar summarized by Search Engine Journal, Trendos Chief Commercial Officer Gintare Rimolaityte outlined a citation-mapping workflow built around those differences. The approach starts with a focused set of commercial questions, records the URLs cited by individual AI systems and classifies those sources before looking for competitor gaps. It is an observational methodology, not an experiment proving that any particular optimization will cause an AI engine to cite a brand.
Start with buyer questions, not a universal visibility score
The proposed audit begins with roughly 10 to 20 questions that customers might ask while evaluating a product or service. Rather than trying to represent an entire business with hundreds of loosely connected prompts, the recommendation is to select a manageable set around one buying decision. Those questions then become the common unit of analysis across Google AI Overviews, ChatGPT, Gemini and Perplexity.
For each question, the analyst records the answer, observation date and cited URLs separately for each engine. That separation is fundamental. If all citations are immediately pooled into one total, a source that matters heavily in one system can appear less important, while a source category that dominates another system can disappear inside the average. An aggregate score may still be useful as a headline KPI, but it is a poor substitute for the underlying citation map when deciding what to do next.
Trendos' own Citation Insights documentation reflects this source-oriented model. The platform tracks cited domains and exact pages, categorizes source types and compares where a brand and its competitors appear. The practical question is therefore not simply, “How visible are we in AI?” It is, “Which sources are these systems using for the questions that influence our buyers, and where are we absent?”
The source mix changes by industry
Trendos has also published a broader observational analysis based on 107 million AI answers. In that dataset, the company compared leading citation sources across IT and solution services, consumer goods and communication services, looking across ChatGPT, Perplexity, Gemini and Google AI Overviews. The results illustrate why an industry-neutral prescription can be misleading.
In the Trendos analysis published by Search Engine Journal, community and user-generated sources represented about half of the leading citations across all three examined industries when the four engines were equally weighted. The other half varied sharply. Consumer goods showed a much larger role for brand, retail and owned sources, while IT and solution services leaned much more heavily toward independent editorial and reference sources alongside communities. Communication services also showed substantial independent editorial representation.
Those observations do not establish a universal causal rule about what an AI system “prefers.” They describe the citation composition Trendos observed in its sample. Still, they are strategically useful because they show how a single generic playbook can misallocate effort. Improving first-party product information may be a logical priority in a retail category where owned and retail pages frequently appear, while a B2B technology company may discover that review sites, communities and independent publications occupy much more of its relevant citation map.
The engine matters as much as the category
The webinar also emphasized that citation behavior should remain visible at the engine level. Rimolaityte used Reddit as an example: reduced prominence in one system does not mean the platform has become irrelevant everywhere. Search Engine Journal's recap notes differences in the balance of community, editorial and brand-owned sources across Google AI Overviews, Perplexity, ChatGPT and Gemini, with Gemini's mix in the examples particularly dependent on industry.
This is where a blended AI visibility score becomes potentially deceptive. Imagine that a brand gains citations in one engine while losing them in another. The aggregate may barely move even though the underlying opportunity has changed substantially. The same problem appears when a domain category becomes more influential for one set of buyer questions but less influential elsewhere. Averaging the data can smooth away precisely the variation that should guide content, digital PR, review-site and community investment.
A useful reporting structure therefore keeps at least three dimensions available beneath any executive-level score: the buyer question or prompt cluster, the AI engine and the source category. Teams can still summarize performance, but the summary should remain drillable into the actual URLs and contexts that produced it.
Classify the sources before deciding what to optimize
After collecting citations, Trendos recommends grouping them by type. The webinar examples distinguish owned or retail pages, community and user-generated content, reviews, and independent editorial or reference sources. That classification turns a list of URLs into an investment map because each source type requires a different intervention.
If owned pages dominate an important prompt cluster, the work may involve clearer product facts, stronger question-and-answer content or better structured information. If review platforms are repeatedly cited, accurate listings and legitimate customer feedback become more relevant. If independent editorial pages dominate, digital PR and expert outreach may deserve more attention. When communities are prominent, useful participation in the places where customers already discuss the category can matter independently of whether an AI citation follows.
Rimolaityte specifically cautioned against treating community participation as something that can simply be purchased or manufactured. Honest participation from identifiable company or employee voices is different from creating disguised accounts purely to influence AI outputs. That distinction matters because the methodology identifies where conversations occur; it does not justify manipulating those conversations.
Competitor citations turn the map into a worklist
The most actionable stage comes after the map is built. Analysts inspect cited pages where competitors appear but their own brand does not. That produces a much more specific opportunity than a generic instruction to “get more AI mentions.” The team now has an exact buyer question, a specific source URL, an engine that cited it and evidence that a competitor is already represented there.
The next step depends on the page. A brand may legitimately belong in a comparison article, an outdated product listing may need correction, an owned page may be missing information that competing pages provide, or a relevant community discussion may reveal a customer question the company has not answered well. Some gaps will have no legitimate action at all. Citation mapping is therefore a prioritization mechanism, not permission to force a mention onto every source.
Trendos recommends considering citation share rather than treating every discovered domain equally. This is an important refinement. A publication that appears once for a marginal prompt should not automatically receive the same effort as a source repeatedly used across high-intent questions. Frequency, commercial relevance and the feasibility of improving brand representation all help determine whether a citation gap deserves resources.
Why one score is useful for reporting but weak for diagnosis
There is nothing inherently wrong with an AI visibility score. Trendos itself offers unified visibility reporting alongside source-level analysis. The problem begins when the summary metric is treated as the strategy. A score can tell a team that visibility changed; it cannot, by itself, explain whether the movement came from ChatGPT, Gemini, Perplexity or Google AI Overviews, which buyer questions changed, or whether the underlying sources were owned pages, reviews, communities or editorial publications.
The same principle is familiar from conventional SEO. An overall visibility index can be useful for trend monitoring, but nobody would diagnose a ranking decline without examining queries, pages, SERP features and competitors. AI search adds another layer because the generated answer and its cited sources can diverge from the traditional search results that marketers are accustomed to monitoring.
That is why the citation map and the search map should be treated as related but distinct datasets. A brand can rank prominently in conventional Google results without appearing among the sources cited in an AI response. Conversely, a page outside the expected organic leaders may become an important source for a particular AI system. Measuring only the brand mention or only the conventional ranking leaves part of that information chain invisible.
Repeat the same questions over time
The final part of the workflow is repetition. Teams assign specific content, outreach, listing or community tasks, then rerun the same buyer questions and compare the source mix over time. Keeping the prompt, engine, observation date and URL together is essential because AI answers can vary and the underlying products change quickly.
This longitudinal approach also prevents teams from overreacting to a single snapshot. One citation is not proof of durable source preference, and one missing citation is not proof that a domain has become irrelevant. Repeated observations can show whether a pattern persists strongly enough to influence investment decisions.
The broader lesson is that AI visibility is becoming less useful as a single number and more useful as a map. The map reveals which engines rely on which sources for which commercial questions, where competitors already have representation and what kind of work could plausibly close the gap. Trendos' webinar does not promise that following the map will produce citations, and the observational data should not be interpreted as causal evidence. But it provides a disciplined alternative to optimizing against an average that may conceal the real opportunity.