

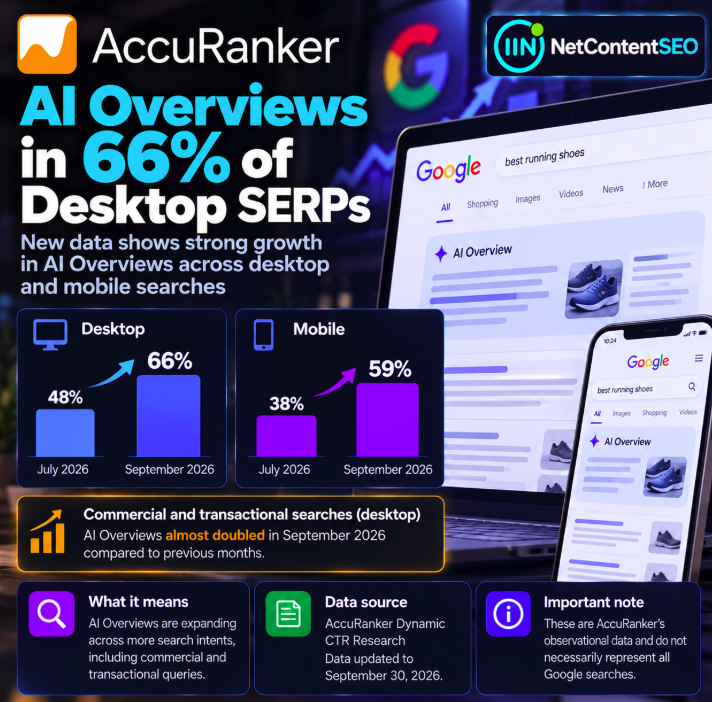

Google AI Overviews appeared on 66% of desktop search results pages and 59% of mobile results within AccuRanker's monitored dataset by September 30, 2026, according to research published October 7. In July, the corresponding figures were 48% for desktop and 38% for mobile. The findings point to rapid expansion across the search results AccuRanker tracks, including stronger coverage of commercial and transactional queries.
These are observational measurements from AccuRanker's monitored SERPs, not an official Google-wide census. They should not be presented as proof that two-thirds of every search performed on Google now shows an AI Overview. The source is AccuRanker's Dynamic CTR research.
AI Overview prevalence: July versus September 2026
| Device | July 2026 | September 2026 | Change |
|---|---|---|---|
| Desktop | 48% | 66% | +18 percentage points |
| Mobile | 38% | 59% | +21 percentage points |
Desktop prevalence increased by 37.5% relative to its July level (18 divided by 48), while mobile increased by approximately 55.3% relative to July (21 divided by 38). These relative growth calculations should not be confused with percentage-point changes.
The reported figures describe the presence of the AI Overview feature in the tracked search results. They do not, by themselves, quantify user clicks, publisher traffic losses, ad revenue or the share of AI Overview answers that cite a particular site.
Why commercial and transactional queries matter
The most notable qualitative finding in the supplied research summary concerns desktop searches with commercial or transactional intent. AccuRanker reports that AI Overview presence in these monitored query groups nearly doubled during September.
This is significant for SEO strategy because commercial and transactional searches often sit closer to purchase decisions than purely informational questions. If an AI-generated answer appears in these result types more often, brands may need to measure visibility across both conventional listings and AI-generated answer surfaces.
However, the supplied summary does not include the exact start and end percentages for the commercial and transactional subgroups. It would be misleading to invent those values or extrapolate them to all shopping-related searches.
What the 66% figure actually measures
A SERP-feature prevalence metric answers a specific question: in the observed set of search result pages, how often was a particular feature detected? It does not automatically tell us how often real users encountered that feature across the entire Google ecosystem.
Sampling design matters. A tracked keyword portfolio can differ from the distribution of all Google queries by industry, search intent, location, language, device, query frequency and customer behavior. Results from an SEO monitoring dataset are useful for detecting trends within its coverage, but they require caution when generalized beyond that coverage.
For this reason, the accurate headline is that AI Overviews reached 66% of tracked desktop SERPs—not 66% of all Google searches.
Desktop and mobile are both expanding, but not identically
Desktop rose from 48% to 66%, an 18-point increase. Mobile rose from 38% to 59%, a 21-point increase. Mobile's relative increase was larger because it started from a lower base.
By September, the measured gap between desktop and mobile was seven percentage points, compared with ten points in July. Within this dataset, the two device categories therefore moved closer together, although desktop still had the higher measured prevalence.
That difference reinforces the importance of device-specific reporting. A blended visibility metric can obscure meaningful differences in what desktop and mobile users see.
Does higher AI Overview prevalence mean lower organic CTR?
Not necessarily, and not in a directly measurable one-to-one way. The prevalence of an AI Overview is different from the click-through rate of organic results. To evaluate CTR effects, analysts need impression and click data, position information, query cohorts, device segmentation and ideally comparisons that account for seasonality and changing search demand.
AI Overview presence may change page layout and user behavior, but the figures cited here do not establish a precise causal impact on any publisher's clicks. It would be inaccurate to claim that an 18-point increase in AI Overview prevalence caused an 18% decrease in CTR.
How publishers should investigate their own exposure
- Segment queries by intent. Separate informational, navigational, commercial and transactional searches instead of relying only on sitewide averages.
- Compare devices. Analyze desktop and mobile impressions, clicks and CTR independently.
- Track observed SERP features. Use a consistent keyword panel to record whether an AI Overview appears for each query, location and device.
- Measure change over time. Compare stable cohorts and note dates of content updates, ranking shifts and seasonality.
- Review citation presence separately. An AI Overview appearing does not imply that the publisher's page is cited inside it.
- Check conversion outcomes. A click decline does not automatically mean the same proportional change in leads, sales or qualified visits.
Google Search Console provides useful performance data, but it does not offer a universal, dedicated breakdown of AI Overview appearances for every impression in the way a third-party SERP monitoring study can attempt. Combining sources requires clear definitions and awareness of their limitations.
What this means for AI visibility and GEO
The expansion of AI Overviews across a monitored keyword set suggests that research teams should not limit AI visibility analysis to informational searches. Commercial and transactional queries deserve their own observation panels, especially for brands that depend on product comparisons, service discovery or purchase-intent traffic.
GEO measurement should distinguish at least three outcomes: whether an AI Overview is present, whether the brand or its content appears within that Overview, and whether the user subsequently clicks or converts. These are separate dimensions, and none can be inferred automatically from the others.
Research limitations
AccuRanker's reported data is proprietary and observational. The supplied summary identifies the measurement dates and headline percentages but does not specify every sampling detail, the full keyword composition or causal controls. Accordingly, this report does not extrapolate the percentages to all Google searches or treat them as official Google figures.
The finding that commercial and transactional desktop coverage nearly doubled is attributed to the research. Without the subgroup's underlying numerical values, no precise baseline or final percentage is claimed.
FAQ
Did Google AI Overviews reach 66% of all searches in September 2026?
No. The 66% figure refers to desktop SERPs in AccuRanker's monitored dataset.
What percentage of tracked mobile SERPs showed AI Overviews?
59% by September 30, up from 38% in July, according to the research summary.
How much did desktop prevalence increase?
From 48% to 66%, an increase of 18 percentage points.
Did commercial and transactional AI Overviews grow?
Yes. AccuRanker reports that their prevalence in the monitored desktop queries nearly doubled during September.
Does the study prove AI Overviews reduced organic traffic?
No. Feature prevalence alone cannot establish a causal CTR or traffic effect.
Should GEO audits include commercial keywords?
Yes. The observed expansion makes commercial and transactional query groups useful candidates for systematic monitoring, while results should be interpreted within the chosen sample.
NetContentSEO analysis
The important shift is not simply that AI Overviews appear more often, but that their observed reach is broadening across query intents and devices. For SEO teams, the appropriate response is better measurement: maintain stable query cohorts, compare desktop with mobile, record AI Overview presence and citations separately, and test how those observations relate to actual clicks and business outcomes. AccuRanker's numbers are a strong signal within its tracked dataset, but not a universal estimate of Google search behavior.
Primary source: AccuRanker — Dynamic CTR Research, published October 7, 2026; data through September 30, 2026, as reported in the supplied research brief.