

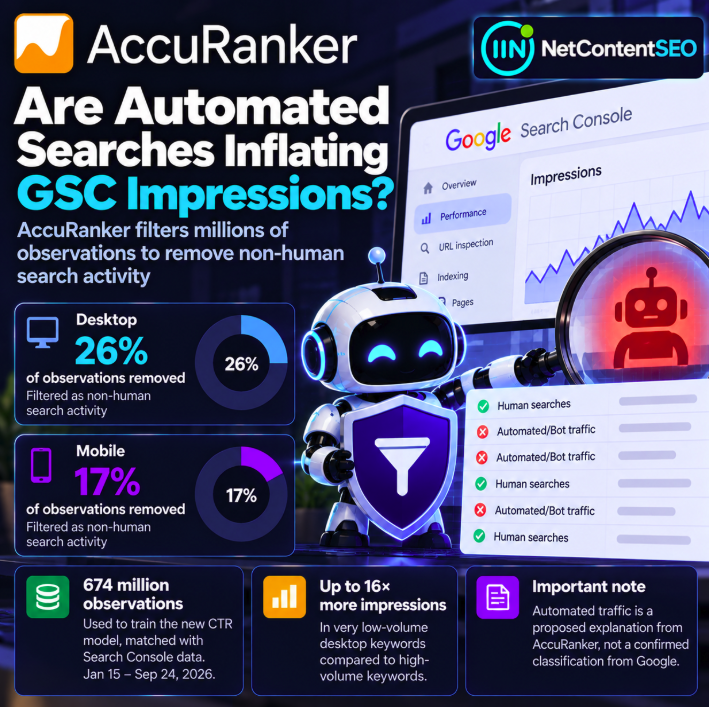

Could automated searches be distorting the impression counts SEO teams use to interpret Google Search Console performance? AccuRanker's October 7, 2026 methodological report raises that possibility after analyzing 674 million observations matched with Google Search Console data for a rebuilt click-through rate (CTR) model. The observations span January 15 through September 24, 2026.
During its modeling process, the company filtered out 26% of desktop observations and 17% of mobile observations using a method intended to exclude impressions inconsistent with human search behavior. In very low-volume desktop keywords, it also observed impression-to-search ratios as much as 16 times higher than for high-volume keywords.
These findings deserve attention, but the distinction is critical: the removed observations were filtered by AccuRanker's methodology; Google has not confirmed that those individual impressions came from bots. The figures cannot be generalized into a claim that 26% of all desktop Search Console impressions are fake.
Primary source: AccuRanker — Rebuild of the Dynamic CTR Model.
What AccuRanker analyzed
The company reports using 674 million observations matched with Search Console data to train its new CTR model. The stated observation period ran from January 15 to September 24, 2026, giving the researchers a large dataset covering multiple months and device categories.
Matched observations are not equivalent to every Google search or every impression across the web. The dataset reflects the information available to the researchers and the matching criteria used in their modeling pipeline.
The key numbers
| Metric | Reported finding |
|---|---|
| Observations matched with GSC | 674 million |
| Observation period | January 15–September 24, 2026 |
| Desktop observations excluded by filter | 26% |
| Mobile observations excluded by filter | 17% |
| Very-low-volume desktop keyword impression/search ratio | Up to 16× that of high-volume keywords |
| Confirmed Google bot classification? | No |
The percentages apply to observations filtered within the study's methodological process. They should not be interpreted as a measured bot share of all Google Search Console traffic.
Why would a CTR model need to filter impressions?
CTR models aim to estimate how often searchers click results under different conditions. If some observations contain impression patterns that are not representative of typical human search behavior, including them without adjustment could distort the relationship between impressions and clicks.
Filtering anomalous records is a methodological choice intended to improve the relevance of a model's training data. However, filtering does not itself establish the cause of the anomaly. It can flag observations that fail specified consistency criteria without identifying the individual source of each impression.
What does the 16× ratio mean?
AccuRanker reports that, for very-low-volume desktop keywords, the ratio between observed impressions and estimated searches reached levels up to 16 times those associated with high-volume keywords. This is an unusual pattern worth investigating because impressions and estimated search demand would not ordinarily be expected to diverge identically across every query class.
But the metric is a ratio comparison, not proof that a keyword received sixteen times more bot traffic, nor evidence that every excess impression is invalid. Keyword-volume estimates, sampling, reporting definitions, repeated result exposures and other measurement differences may contribute to discrepancies. The report proposes automated search activity as a possible explanation, not a Google-confirmed diagnosis.
Automated searches: a plausible explanation, not a confirmed label
Automated queries can arise from various systems, including rank monitoring, testing and other software-driven retrieval. It is reasonable for researchers to examine whether such activity could influence observed search-result impression patterns. Nevertheless, the study does not provide a Google-issued per-impression classification that establishes which records were generated by automation.
The correct interpretation is therefore narrower than the provocative headline: AccuRanker found patterns it considered inconsistent with normal human search activity and excluded substantial shares of observations when rebuilding its CTR model. That is not the same as independently verifying the identity of every searcher behind those observations.
Why Search Console users should care
Search Console impressions are commonly used to evaluate search visibility, compare periods and calculate CTR. If the mix of recorded impressions changes for reasons unrelated to actual human demand, an analyst might mistakenly conclude that a page is being shown to more potential visitors while click growth remains flat.
For example, an increase in impressions with stable clicks will mathematically reduce CTR. Yet that pattern can have many causes, including changes in query mix, ranking, search features, device distribution and user behavior. The AccuRanker findings introduce a measurement-quality question; they do not provide a universal explanation for CTR declines.
How to investigate suspicious impression patterns
- Segment by device. Compare desktop and mobile separately rather than assuming the same pattern affects both.
- Inspect low-volume queries carefully. Look for unusually large impression changes relative to historical demand, while accounting for reporting thresholds and sampling limitations.
- Compare stable query cohorts. Avoid comparing different keyword mixes as though they were identical populations.
- Check clicks and business outcomes. If impressions rise sharply but clicks and conversions do not, investigate further rather than immediately assigning a cause.
- Review location, page and date patterns. Concentrated anomalies may be easier to interpret than a sitewide average.
- Corroborate with independent sources. External rank tracking, server-side observations and analytics can help contextualize changes, although none provides a perfect reconstruction of all Google searches.
- Record hypotheses explicitly. Label possible automated activity as an interpretation unless direct evidence supports a stronger claim.
What not to conclude from the filtering percentages
It would be incorrect to claim that Google has officially admitted bot inflation in Search Console, that 26% of every site's desktop impressions are fraudulent, or that the study proves automated activity caused a particular publisher's traffic loss. The data and methodology are AccuRanker's, and the filtered shares are specific to its research process.
Likewise, removing observations to train a CTR model does not mean Google Search Console has changed how it counts impressions. The report describes an independent modeling decision, not a documented Google reporting update.
Implications for SEO and AI Search measurement
AI search is making visibility measurement more complicated because conventional organic listings, AI Overviews and third-party answer interfaces create different opportunities for exposure. AccuRanker's methodological finding is a reminder that even familiar metrics such as impressions need careful interpretation.
For SEO and GEO dashboards, separate reported impressions, actual clicks, observed SERP features and verified AI citations. These measures should not be combined into a single visibility claim without clear definitions. An unexplained increase in impressions is not automatically evidence of growing human reach, and a falling CTR is not automatically evidence of AI Overview cannibalization.
Questions for future research
The next useful step would be greater transparency around how anomalous observations are identified, how sensitive CTR estimates are to the chosen filters and whether comparable patterns appear across independent datasets. It would also help to distinguish possible automated-query effects from ordinary differences between keyword-volume estimates and impression reporting.
Until then, the study provides a reason to scrutinize impression anomalies, not a definitive census of automated Google searches.
FAQ
How many observations did AccuRanker use?
674 million observations matched with Google Search Console data, covering January 15 through September 24, 2026.
What proportion of observations was filtered?
AccuRanker reports excluding 26% of desktop observations and 17% of mobile observations under its filtering methodology.
Does this mean 26% of all desktop GSC impressions are bots?
No. The percentage refers to observations excluded from AccuRanker's dataset and is not a Google-confirmed bot-traffic estimate.
What was the 16× finding?
In very-low-volume desktop keyword groups, impression-to-search ratios reached up to sixteen times the ratios seen for high-volume keywords.
Did Google confirm the suspected automation?
No such confirmation is established by the research summary.
Can automated queries lower reported CTR?
If additional impressions are counted without proportional clicks, calculated CTR falls. But this study does not prove that automated activity explains any specific site's CTR change.
NetContentSEO analysis
AccuRanker's research raises a serious measurement question, but its strongest contribution is methodological rather than accusatory. Filtering 26% of desktop and 17% of mobile observations shows how much a CTR model may depend on assumptions about representative search behavior. For publishers, the lesson is to investigate unusual impression growth and CTR changes with multiple signals—and to avoid presenting suspected automation as a confirmed Google finding.
Primary source: AccuRanker — Rebuild of the Dynamic CTR Model, October 7, 2026.